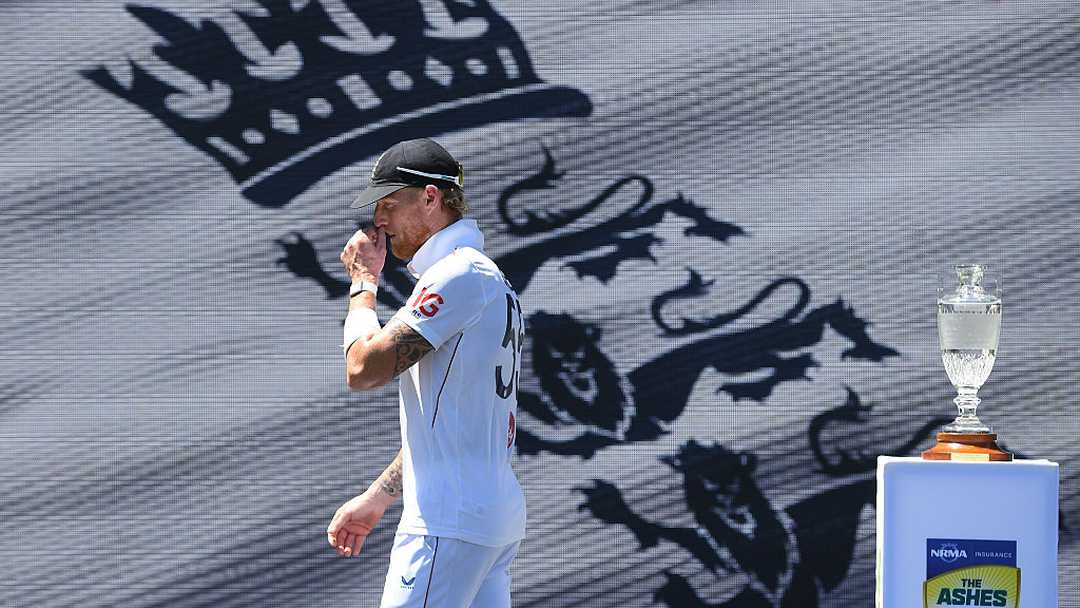
England's Ashes misery Down Under: How Bazball faltered in its ultimate Test
To capture the essence of Bazball, it's crucial to revisit two things.
First, the contrast before and after Ben Stokes and Brendon McCullum took over. Between January 2021 and the start of the 2022 home summer, England won 4, lost 11, and drew 5 Tests. From June 2022 until the start of the 2025/26 Ashes, they won 25, lost 14, and drew 2.
Second, the aggressive sporting mantras England have historically embraced in Ashes triumphs, like Ian Botham's 149* in 1981 and Kevin Pietersen's counter-attacks in 2005.
However, a closer look reveals a downgrade. While England have pulled off remarkable run-chases, losing from positions of strength has become more frequent, especially since 2024, characterized by untimely second-innings collapses.
England in Tests since June 2022 (Bazball era)
| Matches | Won | Lost | Drawn | Win% | |
|---|---|---|---|---|---|
| 2022-2023 | 18 | 13 | 4 | 1 | 72.22% |
| Since 2024 | 28 | 13 | 14 | 1 | 46.43% |
England in Tests since June 2022 (by opponents)
| Opponent | Matches | Won | Lost | Drawn | Win% |
|---|---|---|---|---|---|
| vs AUS & IND | 21 | 7 | 12 | 2 | 33.33% |
| vs other teams | 25 | 19 | 6 | 0 | 76% |
Despite a stronger overall record in the Bazball era, this was considered England's best chance to win a series in Australia since 2010/11, especially given Australia's injury-marred pace attack. Instead, it was the same old story, with just one win in their last four trips to Australia.
The Ashes 2025/26 topped all-time scoring-rate records, but it was Australia who led the way.
Best scoring rates in a five-match Test series
| Series | Hosts | Overall run-rate | Run-rate (ENG) | Run-rate (AUS) |
|---|---|---|---|---|
| Ashes 2025/26 | Australia | 4.07 | 3.89 | 4.25 |
| Ashes 2023 | England | 3.93 | 4.74 | 3.35 |
Australia scored at a superior rate, led by Travis Head's belligerence, Alex Carey's grit, and Mitchell Starc's cameos. In a telling contrast, Australia bowled 84 maidens to England's 71 this series, a reversal from 2023 (34 to Australia vs 171 to England).
England were forced to mend their batting ways. They batted 190.1 and 185.5 overs in Adelaide and Sydney respectively, the most in a Test in the Bazball era. Their series run-rate of 3.89 was a dip from 4.44 prior.
The attacking shot percentage was even at 31.6% for both teams this series, down from 43.3% for England in 2023. Barring Ben Duckett, every top-seven batter had a drop in strike-rate.
Batting strike-rates for England since June 2022
| Player | June 2022 – Aug 2025 | Ashes 2025/26 |
|---|---|---|
| Joe Root | 66.89 | 58.3 |
| Harry Brook | 87.52 | 81.73 |
| Ben Duckett | 87.84 | 91.4 |
| Zak Crawley | 73.48 | 64.08 |
| Ben Stokes | 65.09 | 36.58 |
England's top-order struggles
England's top-three were a collective failure, barring Jacob Bethell's hundred in the final Test. They lost a wicket in the first over four out of ten times. The opening pair of Crawley and Duckett lasted just 22 balls on average.
Opening partnership stats in Ashes 2025/26
| Team | Runs | Ave | Balls/dismissal |
|---|---|---|---|
| England | 191 | 19.1 | 22 |
| Australia | 398 | 39.8 | 46.2 |
Individually, Crawley's series average of 31.2 ranks lowest among 58 batters with at least 90 innings in the top-three in Test history. Duckett became the 11th batter to bat 10+ times in the top-three in a series without a 50-plus score.
Intent or recklessness – The Brook and Smith story
Harry Brook and Jamie Smith had high expectations but couldn't produce when it mattered. Root (400) and Brook (358) were the only England batters over 300 runs, but Brook had five dismissals between 30 and 45. Smith's shot selection drew severe criticism, particularly a dismissal on the second morning in Sydney.
While the attacking shot-percentage was identical for both teams, the timing and method benefited Australia. Travis Head attacked 47.5% of the deliveries he faced.
Batting by shot-making in the series
| Team | Shot Type | Runs | Balls | Wickets | Ave | SR |
|---|---|---|---|---|---|---|
| Australia | attacking | 1770 | 1191 | 39 | 45.38 | 148.61 |
| England | attacking | 1694 | 1259 | 46 | 36.82 | 134.55 |
Inefficiency with the ball and in the field
Ben Stokes (15 wickets) was England's most effective bowler, though Brydon Carse (22) and Josh Tongue (18) took more. Mitchell Starc was the only bowler to open in all 10 innings, taking 31 wickets.
England's catching efficiency was 75.3%, inferior to Australia's 85.3%, dropping 18 catches to the hosts' 12.
Opening bowlers' stats in the series
| Team | Balls | Runs | Wickets | Ave | SR | Econ |
|---|---|---|---|---|---|---|
| Australia | 1804 | 1120 | 57 | 19.64 | 31.6 | 3.72 |
| England | 1698 | 1137 | 31 | 36.67 | 54.7 | 4.01 |
England quicks bowled 42.7% back-of-a-length or shorter to Australia's top seven, compared to Australia's 33.5%. Australia's seamers hit a good length 49% of the time, compared to England's 39%.
Seamers bowling good-length balls vs top seven
| Team | Balls | Runs | Wickets | Ave | SR |
|---|---|---|---|---|---|
| Australia | 1318 | 663 | 37 | 17.91 | 35.6 |
| England | 987 | 401 | 16 | 25.06 | 61.6 |
Just 183 overs of spin were bowled in the series, the fifth-least in a five-match Test series and the least ever in Australia.
Related Posts
 Rajasthan Royals vs Chennai Super Kings,3rd Match,Indian Premier League 2026,2026-03-30 15:00 GMT
 Can Dube level it up for CSK?
 Reyneke’s last-ball six on ODI debut seals dramatic win for SA